Confusing Activity Metrics with Outcomes - AI Productivity Myths
AI dashboards track commits, PRs and adoption, not outcomes. Why activity metrics mislead engineering leaders, and the one question that shows real value.
AI Productivity Myths: Lessons from the Real World #3
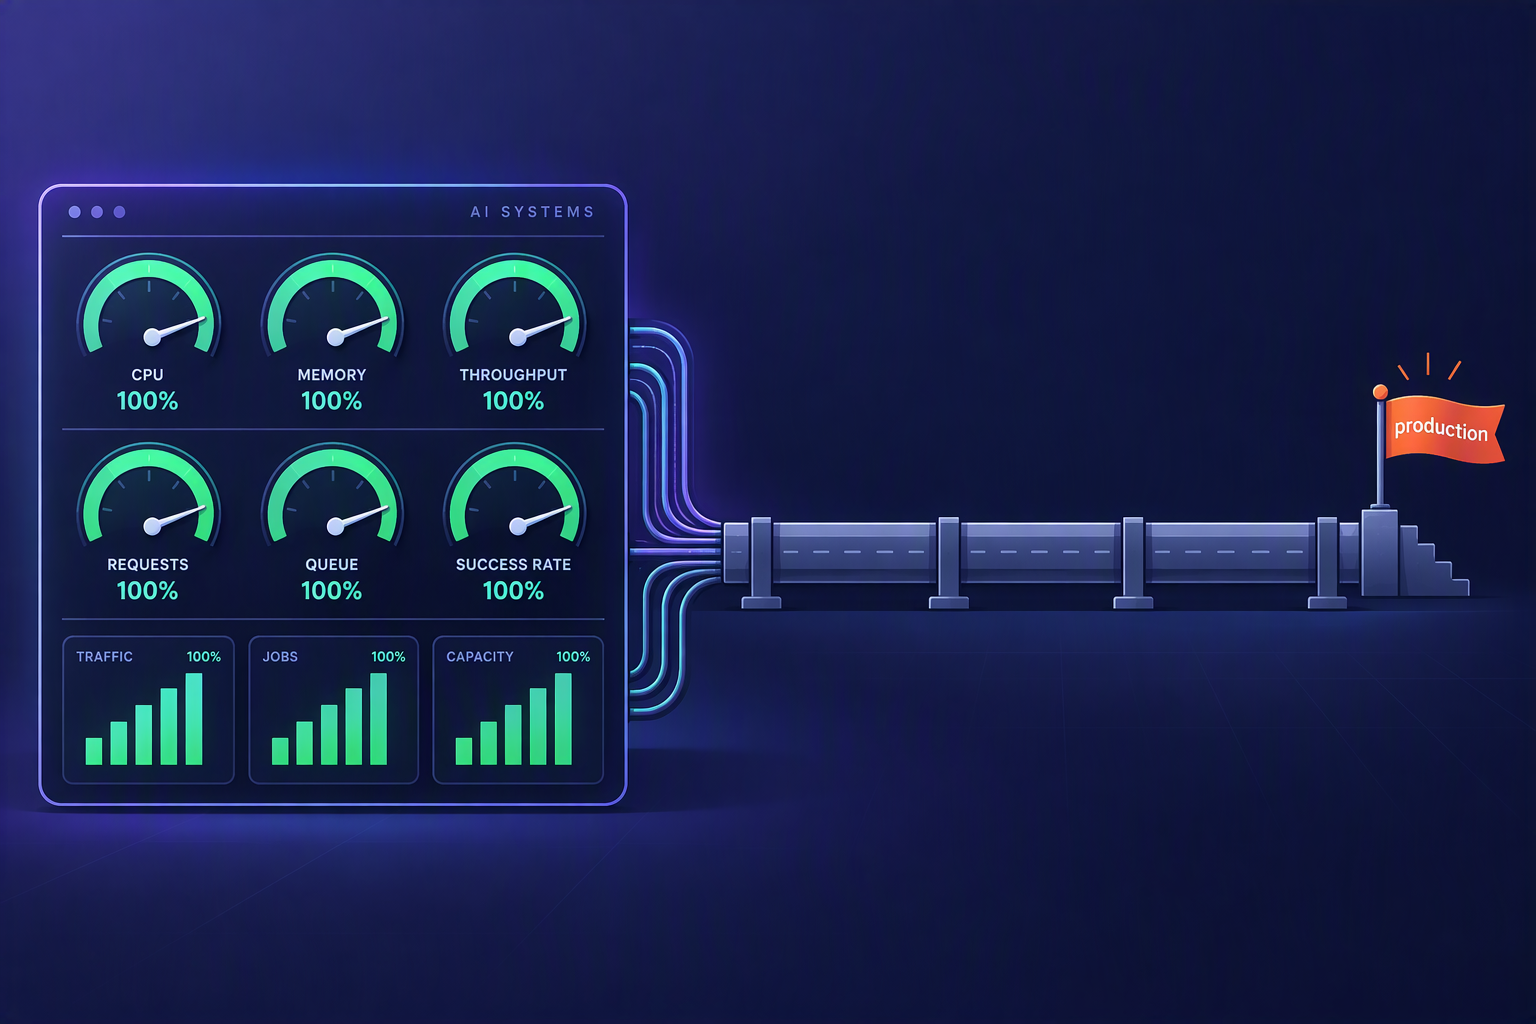
Your AI dashboard is measuring motion. Nobody connected that motion to outcomes anyone outside engineering would recognise as value.
Last quarter, a director I work with pulled me into a review of their AI adoption metrics. The dashboard was impressive, and it showed tool adoption at 92%, commits per developer up 35%. But I could not find one thing in it: “What shipped to production that would not have shipped without this?” Six months of investment, a wall of encouraging numbers, and no answer to the only question the business needs answered.
I have seen the same pattern in several teams and nobody is lying. The dashboards measure a layer that doesn’t connect to anything outside engineering, and most of the people reading them haven’t noticed.
Motion Is Not the Same as Movement
Last time I argued that coding was never where the delivery time went. That has an awkward consequence for any dashboard that counts code.
Earlier this year, a team I worked with adopted AI tools and saw their commit velocity jump 40%. That is the kind of number that looks great in a slide deck. I know because I have seen it in several.
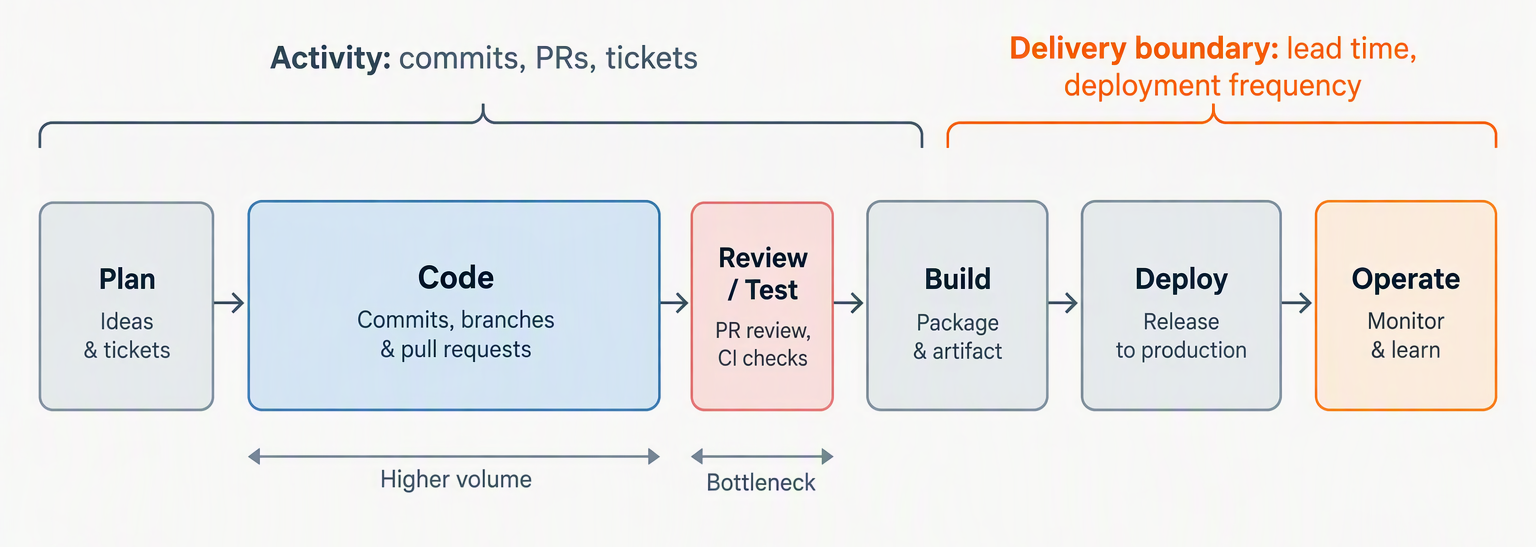
But when I looked at their lead time — ticket creation to production deployment — it had not moved. At all. The activity counter went up and the delivery clock stayed put, because the counter was sitting upstream of the constraint. The dashboard improves. The system sits still.
To be fair, not every activity metric is useless. DORA’s deployment frequency and lead time for changes correlate with delivery performance, and I’ve leaned on that research myself. The difference is where they sit. They measure how fast value reaches users, while commit counts and PR velocity measure churn inside the team. We picked the wrong layer.
The Metrics That Lie to You
Commits, PRs and tickets closed all measure motion, not destination. A team can double their PR count while shipping the same user facing value. They can close more tickets by slicing work thinner without increasing total throughput. More activity in the middle. Same speed at the edges where customers actually feel it.
Adoption rate is worse. In McKinsey’s 2026 survey, only 37% of 1,719 respondents could attribute any EBIT impact to AI. Another 31% saw some impact below 5%, and just 6% cleared it. The 2025 survey landed at 39%, so a year of heavier investment moved almost nothing. Use is close to universal, whereas impact isn’t.
Developer satisfaction is the subtlest trap. METR’s own study Feb 2026 update says the 19% slowdown from Part 1 probably read low, so I wouldn’t quote it any more. What held up is the perception gap. Developers predicted a 24% speedup and afterwards still believed they’d been about 20% faster. They couldn’t feel the real effect, whatever it was, so a satisfaction survey is blind to exactly the failures you care about.
And beneath all of this: a Harness survey of 700 practitioners and managers, run in April, found 81% say developers spend more time in code review since adopting AI coding tools. The generation phase feels productive. Fast. Satisfying. Meanwhile the total cognitive load on the team grows quietly in the background because extra reviews mean more to understand. None of that shows up anywhere a decision maker would see it.
The best field data I’ve seen is a longitudinal study of an enterprise “2x” mandate: 802 developers and 196,212 pull requests, January 2024 to April 2026. Merged PRs per developer hit 2.09 times the baseline, and per-reviewer load roughly doubled with it. Merge and revert rates held steady, so quality didn’t visibly collapse. The fair reading is that the counter moved, the load moved with it, and the counter can’t tell you whether the extra volume was worth carrying. Same as Microsoft’s 24% in Part 1: a bigger number of the same unit is still the same unit.
What They Did Next
That team with the 40% commit velocity increase did something more interesting than celebrate. They noticed the activity metric had moved but the outcome metric had not, and they treated that gap as a diagnostic signal rather than an inconvenience.
They redirected AI usage toward the actual bottleneck: automated test generation for their integration suite, AI-assisted code review to reduce reviewer load, smaller deployment batches. Their first attempt flopped badly. They pointed Copilot at the integration tests and got a wave of green-path-only cases that passed CI but caught nothing real. The test suite grew 40% without improving defect escape rate at all. Forty percent more tests and zero additional safety.
It took three weeks of pairing with QA to build prompts that generated tests against actual failure modes from their incident log. After that recalibration, lead time actually dropped. The commit count went back down, which looked terrible on the old dashboard. Fewer changes, but larger, better-tested, moving through the pipeline cleanly. Lead time dropped 30%, and that was the metric that mattered.
That is outcome measurement done right. You do not ask “is the tool being used?” You ask “did the constraint move?”
The Work That Was Previously Impossible
Here is where my thinking on this shifted. The most valuable thing AI did, for another team I work with, was not making existing work faster. Rather it was making stuck work possible.
They had eighteen months of library upgrades sitting in the backlog. Not because nobody wanted to do them. Everyone agreed the dependencies were a risk and must be prioritized. But the manual effort was enormous, estimated 3-4 sprint commitment for updating libraries, fixing breaking changes, rewriting affected tests, validating integration points. Nobody could justify pulling that many people off feature work. So the upgrades sat there, accruing risk, sprint after sprint, while everyone agreed it was important and nobody could make the economics work.
AI changed those economics. What was a quarter’s commitment became a two-week campaign. One developer with AI tooling worked through the dependency chain systematically. The libraries got upgraded. The security posture improved. The team moved on.
That is the binary metric worth tracking: could this team have done this six months ago? Not faster. Not cheaper. Could they have done it at all? For that library upgrade the answer was no — the economics simply did not justify it before. Now they do.
If you implement one new metric from this post, make it this one. Once a month, ask each team lead: “What did you ship this month that was previously stuck?” Not “what did you do faster” — that is an efficiency question, and efficiency gains are incremental, hard to distinguish from noise. “What did you ship that you could not have shipped before?” That is a capability question. The answer tells you whether AI is expanding what your engineering organisation can do, or just making it busier. The line won’t always be clear, but asking the question puts you ahead of most.
The Uncomfortable Question
Here is what I would ask any engineering leader who reports AI success based on activity metrics:
“If you turned off every AI tool tomorrow and your commit count dropped by 30% — but your deployment frequency, defect rate, and lead time stayed the same — would you say the tools were delivering value?”
If the honest answer is “no, because the dashboard would look worse”, you’re measuring the dashboard, not the engineering. It compounds, too. Every quarter justified by activity metrics is a quarter where nobody checks whether the investment works. I’ve watched sunk-cost logic take over with other technology bets, and the dashboard becomes its own justification.
Andrew Diamond, in Software Engineering in the Age of AI, asks who will have the knowledge to verify the bots’ work once the job shifts from creating to supervising. An activity dashboard can’t ask that. It counts what the bots produced and has no column for whether anyone can vouch for it. So I’d put two questions to every team lead: what shipped this month that was previously stuck, and who could vouch for it? The goal was never more activity. It was work that reaches customers and that someone can stand behind.
Next in this series: Ignoring Selection Bias and the Novelty Effect — why early AI success stories rarely survive contact with the full engineering population.
Series: AI Productivity Myths — Lessons from the Real World A series examining how engineering leaders misjudge AI coding productivity, based on industry research and real-world enterprise adoption patterns.
References
- McKinsey, The State of AI (2026 survey, 1,719 respondents), as reported by Tech Times — 37% attribute any EBIT impact to AI, 31% below the 5% threshold, 6% above it
- He et al., AI Writes Faster Than Humans Can Review: A Longitudinal Study of an Enterprise 2x Mandate (July 2026) — 802 developers, 196,212 PRs; merged PRs per developer at 2.09x baseline, per-reviewer load roughly doubled, merge and revert rates steady
- Harness / DevOps Digest, AI Has Outpaced How Engineering Organizations Measure Developer Productivity (April 2026 survey, 700 respondents) — 81% say developers spend more time in code review since adopting AI tools
- METR, Measuring the Impact of Early-2025 AI on Experienced Open-Source Developer Productivity — developers predicted a 24% speedup and afterwards believed they were about 20% faster; the measured 19% slowdown is superseded by METR’s February 2026 update
- Andrew Diamond, Software Engineering in the Age of AI — the shift from creation to supervision, and the verification problem it creates
