Designing Observable Microservice
Microservices must be monitored. Designing an observable microservices. The article discusses why and how microservices should be monitored
The microservice architecture leads to a distributed system that is scalable, flexible and reliable. However, it comes at an expense of added complexity. The microservices interact with each other to complete user transactions. Since a lot is going on in the system, keeping a check on the system health is vital. So another key consideration to design a microservice is observability. The team must be aware of the activities that are happening within the system.
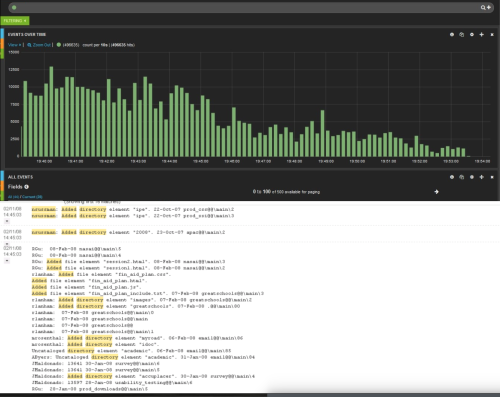
All the microservices with in the system should have centralised monitoring and logging. The data is useful to diagnose problems, if any, and provide quick resolutions. There are many tools available in the market that can help you to monitor the microservices. Some of the popular tools are ELK stack, Splunk, Prometheus etc. These tools can help the team gather stats. This collected data then can be utilised for:
- capacity planning, scaling up or down the system
- observing user behaviours, to diagnose if users are facing any issue in any specific flow
- potential system health issues. CPU usage, memory usage, disk usage etc can provide valuable feedback to the team about the bottlenecks if any
- discovering causes of timeouts, exceptions, and errors happening in the system
While designing a microservice, the team should decide upon:
- the information that needs to be logged. The team should consult security architects to verify the sensitivity of data getting logged
- structure of logs. The information would help the team to debug any potential bug
- valid correlation id for transactions. The correlation id would help the team to trace the transactions in a distributed environment.
The team should thoughtfully insert meaningful logs and audit events within the code. A consistent log format will allow the team to query the logging information. The team can then query for specific patterns and specific error codes using a logging tool.
Teams can also configure alerts using tools such as Pagerduty, Opsgenie etc. The tools can send out some early alerts as emails, slack messages and sms to the team. An example alert could be if there are 25 timeout exceptions in the last 10 min. The tools can also help the team to log these as incidents to be investigated.